libpappsomspp
Library for mass spectrometry
Loading...
Searching...
No Matches
pappso::BaseTracePlotWidget Class Reference

#include <basetraceplotwidget.h>

Inheritance diagram for pappso::BaseTracePlotWidget:
pappso::BasePlotWidget pappso::DriftSpecTracePlotWidget pappso::MassSpecTracePlotWidget pappso::TicXicChromTracePlotWidget

Public Member Functions

 BaseTracePlotWidget (QWidget *parent=0)
 
 BaseTracePlotWidget (QWidget *parent, const QString &x_axis_label, const QString &y_axis_label)
 
virtual ~BaseTracePlotWidget ()
 Destruct this BaseTracePlotWidget instance.
 
virtual void setGraphData (int graph_index, const std::vector< double > &keys, const std::vector< double > &values)
 
virtual void setGraphData (QCPGraph *graph_p, const std::vector< double > &keys, const std::vector< double > &values)
 
virtual void clearGraphData (int graph_index)
 
virtual void axisDoubleClickHandler (QCPAxis *axis, QCPAxis::SelectablePart part, QMouseEvent *event) override
 
virtual void axisRescale () override
 RANGE-related functions.
 
virtual void axisReframe () override
 
virtual void axisZoom () override
 
virtual void axisPan () override
 
virtual QCPGraph * addTrace (const pappso::Trace &trace, const QColor &color)
 
virtual bool findIntegrationLowerRangeForKey (int index, double key, QCPRange &range)
 Find a minimal integration range starting at an existing data point.
 
std::vector< double > getValuesX (int index) const
 
std::vector< double > getValuesY (int index) const
 
QCPRange getValueRangeOnKeyRange (QCPAbstractPlottable *plottable_p, bool &ok)
 
QCPRange getValueRangeOnKeyRange (int index, bool &ok)
 
double getYatX (double x, QCPGraph *graph_p)
 
double getYatX (double x, int index=0)
 
pappso::Trace toTrace (int index) const
 
pappso::Trace toTrace (const QCPGraph *graph_p) const
 
pappso::Trace toTrace (const QCPRange &x_axis_range, int index) const
 
pappso::Trace toTrace (const QCPRange &x_axis_range, const QCPGraph *graph_p) const
 
- Public Member Functions inherited from pappso::BasePlotWidget
 BasePlotWidget (QWidget *parent)
 
 BasePlotWidget (QWidget *parent, const QString &x_axis_label, const QString &y_axis_label)
 
virtual ~BasePlotWidget ()
 Destruct this BasePlotWidget instance.
 
virtual bool setupWidget ()
 
virtual void setPen (const QPen &pen)
 
virtual const QPen & getPen () const
 
virtual void setPlottingColor (QCPAbstractPlottable *plottable_p, const QColor &new_color)
 
virtual void setPlottingColor (int index, const QColor &new_color)
 
virtual QColor getPlottingColor (QCPAbstractPlottable *plottable_p) const
 
virtual QColor getPlottingColor (int index=0) const
 
virtual void setAxisLabelX (const QString &label)
 
virtual void setAxisLabelY (const QString &label)
 
virtual void resetAxesRangeHistory ()
 
virtual void updateAxesRangeHistory ()
 Create new axis range history items and append them to the history.
 
virtual void restorePreviousAxesRangeHistory ()
 Go up one history element in the axis history.
 
virtual void restoreAxesRangeHistory (std::size_t index)
 Get the axis histories at index index and update the plot ranges.
 
virtual void keyPressEvent (QKeyEvent *event)
 KEYBOARD-related EVENTS.
 
virtual void keyReleaseEvent (QKeyEvent *event)
 Handle specific key codes and trigger respective actions.
 
virtual void spaceKeyReleaseEvent (QKeyEvent *event)
 
virtual void directionKeyPressEvent (QKeyEvent *event)
 
virtual void directionKeyReleaseEvent (QKeyEvent *event)
 
virtual void mousePseudoButtonKeyPressEvent (QKeyEvent *event)
 
virtual void mousePseudoButtonKeyReleaseEvent (QKeyEvent *event)
 
virtual void mousePressHandler (QMouseEvent *event)
 KEYBOARD-related EVENTS.
 
virtual void mouseReleaseHandler (QMouseEvent *event)
 
virtual void mouseReleaseHandlerLeftButton ()
 
virtual void mouseReleaseHandlerRightButton ()
 
virtual void mouseWheelHandler (QWheelEvent *event)
 
virtual void mouseMoveHandler (QMouseEvent *event)
 KEYBOARD-related EVENTS.
 
virtual void mouseMoveHandlerNotDraggingCursor ()
 
virtual void mouseMoveHandlerDraggingCursor ()
 
virtual void mouseMoveHandlerLeftButtonDraggingCursor ()
 
virtual void mouseMoveHandlerRightButtonDraggingCursor ()
 
bool isClickOntoXAxis (const QPointF &mousePoint)
 
bool isClickOntoYAxis (const QPointF &mousePoint)
 
int dragDirection ()
 MOUSE-related EVENTS.
 
virtual void moveMouseCursorGraphCoordToGlobal (QPointF plot_coordinates)
 
virtual void moveMouseCursorPixelCoordToGlobal (QPointF local_coordinates)
 
virtual void horizontalMoveMouseCursorCountPixels (int pixel_count)
 
virtual QPointF horizontalGetGraphCoordNewPointCountPixels (int pixel_count)
 
virtual void verticalMoveMouseCursorCountPixels (int pixel_count)
 
virtual QPointF verticalGetGraphCoordNewPointCountPixels (int pixel_count)
 
virtual QCPRange getRangeX (bool &found_range, int index) const
 MOUSE MOVEMENTS mouse/keyboard-triggered.
 
virtual QCPRange getRangeY (bool &found_range, int index) const
 
QCPRange getRange (Enums::Axis axis, RangeType range_type, bool &found_range) const
 
virtual QCPRange getInnermostRangeX (bool &found_range) const
 
virtual QCPRange getOutermostRangeX (bool &found_range) const
 
virtual QCPRange getInnermostRangeY (bool &found_range) const
 
virtual QCPRange getOutermostRangeY (bool &found_range) const
 
void yMinMaxOnXAxisCurrentRange (double &min, double &max, QCPAbstractPlottable *plottable_p=nullptr)
 
void yMinMaxOnXAxisCurrentRange (double &min, double &max, int index)
 
virtual void replotWithAxesRanges (QCPRange xAxisRange, QCPRange yAxisRange, Enums::Axis axis)
 
virtual void replotWithAxisRangeX (double lower, double upper)
 
virtual void replotWithAxisRangeY (double lower, double upper)
 
virtual void hideAllPlotItems ()
 PLOTTING / REPLOTTING functions.
 
virtual void showTracers ()
 Show the traces (vertical and horizontal).
 
virtual void hideTracers ()
 Hide the traces (vertical and horizontal).
 
virtual void drawXScopeSpanFeatures ()
 
virtual void drawYScopeSpanFeatures ()
 
virtual void calculateDragDeltas ()
 
virtual bool isVerticalDisplacementAboveThreshold ()
 
virtual void drawSelectionRectangleAndPrepareZoom (bool as_line_segment=false, bool for_integration=false)
 
virtual void updateIntegrationScopeDrawing (bool as_line_segment=false, bool for_integration=false)
 
virtual void resetSelectionRectangle ()
 
virtual void hideSelectionRectangle (bool reset_values=false)
 
virtual bool isSelectionRectangleVisible ()
 
virtual SelectionDrawingLines whatIsVisibleOfTheSelectionRectangle ()
 
virtual void setFocus ()
 PLOT ITEMS : TRACER TEXT ITEMS...
 
virtual void redrawPlotBackground (QWidget *focusedPlotWidget)
 Redraw the background of the focusedPlotWidget plot widget.
 
virtual void updateContextXandYAxisRanges ()
 
virtual const BasePlotContextgetContext () const
 

Additional Inherited Members

- Signals inherited from pappso::BasePlotWidget
void setFocusSignal ()
 
void lastCursorHoveredPointSignal (const QPointF &pointf)
 
void plotRangesChangedSignal (const BasePlotContext &context)
 
void xAxisMeasurementSignal (const BasePlotContext &context, bool with_delta)
 
void keyPressEventSignal (const BasePlotContext &context)
 
void keyReleaseEventSignal (const BasePlotContext &context)
 
void mousePressEventSignal (const BasePlotContext &context)
 
void mouseReleaseEventSignal (const BasePlotContext &context)
 
void mouseWheelEventSignal (const BasePlotContext &context)
 
void plottableSelectionChangedSignal (QCPAbstractPlottable *plottable_p, bool selected)
 
void integrationRequestedSignal (const BasePlotContext &context)
 
void plottableDestructionRequestedSignal (BasePlotWidget *base_plot_widget_p, QCPAbstractPlottable *plottable_p, const BasePlotContext &context)
 
- Protected Member Functions inherited from pappso::BasePlotWidget
virtual void createAllAncillaryItems ()
 
virtual void updateIntegrationScope (bool for_integration=false)
 
virtual void updateIntegrationScopeRect (bool for_integration=false)
 
virtual void updateIntegrationScopeHorizontalRhomb (bool for_integration=false)
 
virtual void updateIntegrationScopeVerticalRhomb (bool for_integration=false)
 
virtual void updateIntegrationScopeRhomb (bool for_integration=false)
 
virtual QString allLayerNamesToString () const
 
virtual QString layerableLayerName (QCPLayerable *layerable_p) const
 
virtual int layerableLayerIndex (QCPLayerable *layerable_p) const
 
- Protected Attributes inherited from pappso::BasePlotWidget
QString m_name = "NOT_SET"
 Name of the plot widget.
 
QString m_desc = "NOT_SET"
 Description of the plot widget.
 
QString m_fileName
 The name of the data file from which the mass data were read.
 
QString m_axisLabelX
 
QString m_axisLabelY
 
BasePlotContext m_context
 
int m_leftMousePseudoButtonKey = Qt::Key_Less
 
int m_rightMousePseudoButtonKey = Qt::Key_Greater
 
QCPItemLine * mp_selectionRectangeLine1 = nullptr
 Rectangle defining the borders of zoomed-in/out data.
 
QCPItemLine * mp_selectionRectangeLine2 = nullptr
 
QCPItemLine * mp_selectionRectangeLine3 = nullptr
 
QCPItemLine * mp_selectionRectangeLine4 = nullptr
 
QCPItemText * mp_xDeltaTextItem = nullptr
 Text describing the x-axis delta value during a drag operation.
 
QCPItemText * mp_yDeltaTextItem = nullptr
 
bool m_shouldTracersBeVisible = true
 Tells if the tracers should be visible.
 
QCPItemLine * mp_hPosTracerItem = nullptr
 Horizontal position tracer.
 
QCPItemLine * mp_vPosTracerItem = nullptr
 Vertical position tracer.
 
QCPItemLine * mp_vStartTracerItem = nullptr
 Vertical selection start tracer (typically in green).
 
QCPItemLine * mp_vEndTracerItem = nullptr
 Vertical selection end tracer (typically in red).
 
std::size_t m_lastAxisRangeHistoryIndex = 0
 Index of the last axis range history item.
 
std::vector< QCPRange * > m_xAxisRangeHistory
 List of x axis ranges occurring during the panning zooming actions.
 
std::vector< QCPRange * > m_yAxisRangeHistory
 List of y axis ranges occurring during the panning zooming actions.
 
int m_mouseMoveHandlerSkipAmount = 10
 How many mouse move events must be skipped *‍/.
 
int m_mouseMoveHandlerSkipCount = 0
 Counter to handle the "fat data" mouse move event handling.
 
QColor m_unfocusedColor = QColor("lightgray")
 Color used for the background of unfocused plot.
 
QBrush m_unfocusedBrush = QBrush(m_unfocusedColor)
 Color used for the background of unfocused plot.
 
QColor m_focusedColor = QColor(Qt::transparent)
 Color used for the background of focused plot.
 
QBrush m_focusedBrush = QBrush(m_focusedColor)
 Color used for the background of focused plot.
 
QPen m_pen
 Pen used to draw the graph and textual elements in the plot widget.
 

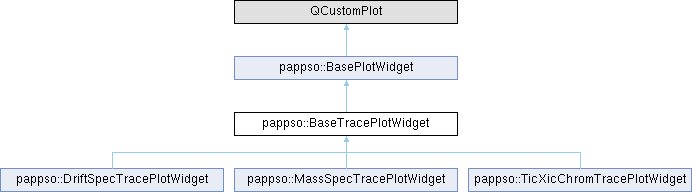
Detailed Description

Definition at line 59 of file basetraceplotwidget.h.

Constructor & Destructor Documentation

◆ BaseTracePlotWidget() [1/2]

pappso::BaseTracePlotWidget::BaseTracePlotWidget ( QWidget * parent = 0)
explicit

Definition at line 44 of file basetraceplotwidget.cpp.

45 : BasePlotWidget(parent)
46{
47 // We can afford to call createAllAncillaryItems() in this derived class
48 // because all the items will have been created *before* the addition of plots
49 // and then the rendering order will hide them to the viewer, since the
50 // rendering order is according to the order in which the items have been
51 // created.
52 //
53 // The fact that the ancillary items are created before trace plots is not a
54 // problem because the trace plots are sparse and do not effectively hide the
55 // data.
56 //
57 // But, in the color map plot widgets, we cannot afford to create the
58 // ancillary items *before* the plot itself because then, the rendering of the
59 // plot (created after) would screen off the ancillary items (created before).
60 //
61 // So, the createAllAncillaryItems() function needs to be called in the
62 // derived classes at the most appropriate moment in the setting up of the
63 // widget.
65}
virtual void createAllAncillaryItems()
BasePlotWidget(QWidget *parent)

References pappso::BasePlotWidget::BasePlotWidget(), and pappso::BasePlotWidget::createAllAncillaryItems().

Referenced by pappso::DriftSpecTracePlotWidget::DriftSpecTracePlotWidget(), pappso::MassSpecTracePlotWidget::MassSpecTracePlotWidget(), pappso::MassSpecTracePlotWidget::MassSpecTracePlotWidget(), and pappso::TicXicChromTracePlotWidget::TicXicChromTracePlotWidget().

◆ BaseTracePlotWidget() [2/2]

pappso::BaseTracePlotWidget::BaseTracePlotWidget ( QWidget * parent,
const QString & x_axis_label,
const QString & y_axis_label )
explicit

Definition at line 68 of file basetraceplotwidget.cpp.

71 : BasePlotWidget(parent, x_axis_label, y_axis_label)
72{
73 // We can afford to call createAllAncillaryItems() in this derived class
74 // because all the items will have been created *before* the addition of plots
75 // and then the rendering order will hide them to the viewer, since the
76 // rendering order is according to the order in which the items have been
77 // created.
78 //
79 // The fact that the ancillary items are created before trace plots is not a
80 // problem because the trace plots are sparse and do not effectively hide the
81 // data.
82 //
83 // But, in the color map plot widgets, we cannot afford to create the
84 // ancillary items *before* the plot itself because then, the rendering of the
85 // plot (created after) would screen off the ancillary items (created before).
86 //
87 // So, the createAllAncillaryItems() function needs to be called in the
88 // derived classes at the most appropriate moment in the setting up of the
89 // widget.
91}

References pappso::BasePlotWidget::BasePlotWidget(), and pappso::BasePlotWidget::createAllAncillaryItems().

◆ ~BaseTracePlotWidget()

pappso::BaseTracePlotWidget::~BaseTracePlotWidget ( )
virtual

Destruct this BaseTracePlotWidget instance.

The destruction involves clearing the history, deleting all the axis range history items for x and y axes.

Definition at line 101 of file basetraceplotwidget.cpp.

102{
103}

Member Function Documentation

◆ addTrace()

QCPGraph * pappso::BaseTracePlotWidget::addTrace ( const pappso::Trace & trace,
const QColor & color )
virtual

Definition at line 184 of file basetraceplotwidget.cpp.

185{
186 // qDebug();
187
188 if(!color.isValid())
189 throw PappsoException(
190 QString("The color to be used for the plot graph is invalid."));
191
192 // This seems to be unpleasant.
193 // setFocus();
194
195 QCPGraph *graph_p = addGraph();
196
197 graph_p->setLayer("plotsLayer");
198
199 // Now depracated as of 20200924
200 // graph_p->setData(QVector<double>::fromStdVector(trace.xValues()),
201 // QVector<double>::fromStdVector(trace.yValues()));
202
203 QVector<double> key_qvector;
204 QVector<double> value_qvector;
205
206#if 0
207 // Now replace the graph's data. Note that the data are
208 // inherently sorted (true below).
209
210 // The begin() -- end() ranges constructor did not work as of
211 // Qt 5.14.2 this day: 20200721
212
213 key_qvector =
214 QVector(trace.xValues().begin(),
215 .trace.xValues()end());
216 value_qvector =
217 QVector(trace.yValues().begin(),
218 trace.yValues().end());
219#endif
220
221 for(auto &value : trace.xValues())
222 {
223 key_qvector.push_back(value);
224 }
225
226 for(auto &value : trace.yValues())
227 {
228 value_qvector.push_back(value);
229 }
230
231#if 0
232
233 qDebug() << "The size of the x values for trace is:" << key_qvector.size()
234 << "and for y values is:" << value_qvector.size();
235
236 QString text;
237
238 for(qsizetype iter = 0; iter < key_qvector.size(); ++iter)
239 text += QString("(%1,%2)\n")
240 .arg(key_qvector.at(iter), 0, 'f', 6)
241 .arg(value_qvector.at(iter), 0, 'f', 6);
242
243 qDebug().noquote() << text;
244
245#endif
246
247
248 graph_p->setData(key_qvector, value_qvector, true);
249
250 QPen pen = graph()->pen();
251 pen.setColor(color);
252 graph()->setPen(pen);
253
254 // Connect the signal of selection change so that we can re-emit it for the
255 // widget that is using *this widget.
256
257 connect(graph_p,
258 static_cast<void (QCPAbstractPlottable::*)(bool)>(
259 &QCPAbstractPlottable::selectionChanged),
260 [this, graph_p]() {
261 emit plottableSelectionChangedSignal(graph_p, graph_p->selected());
262 });
263
264 // Rescaling the axes is actually unpleasant if there are more than one
265 // graph in the plot widget and that we are adding one. So only, rescale if
266 // the number of graphs is == 1, that is we are adding the first one.
267
268 if(graphCount() == 1)
269 {
270 rescaleAxes();
272 }
273
274 replot();
275
276 return graph_p;
277}
virtual void resetAxesRangeHistory()
void plottableSelectionChangedSignal(QCPAbstractPlottable *plottable_p, bool selected)
std::vector< pappso_double > xValues() const
Definition trace.cpp:663
std::vector< pappso_double > yValues() const
Definition trace.cpp:677

References pappso::BasePlotWidget::plottableSelectionChangedSignal(), pappso::BasePlotWidget::resetAxesRangeHistory(), pappso::Trace::xValues(), and pappso::Trace::yValues().

◆ axisDoubleClickHandler()

void pappso::BaseTracePlotWidget::axisDoubleClickHandler ( QCPAxis * axis,
QCPAxis::SelectablePart part,
QMouseEvent * event )
overridevirtual

Reimplemented from pappso::BasePlotWidget.

Definition at line 530 of file basetraceplotwidget.cpp.

534{
535 // qDebug();
536
537 m_context.m_keyboardModifiers = QGuiApplication::queryKeyboardModifiers();
538
539 if(m_context.m_keyboardModifiers & Qt::ControlModifier)
540 {
541 // qDebug();
542
543 // If the Ctrl modifiers is active, then both axes are to be reset. Also
544 // the histories are reset also.
545
546 rescaleAxes();
548 }
549 else
550 {
551 // qDebug();
552
553 // Only the axis passed as parameter is to be rescaled.
554 // Reset the range of that axis to the max view possible, but for the y
555 // axis check if the Shift keyboard key is pressed. If so the full scale
556 // should be calculated only on the data in the current x range.
557
558 if(axis->orientation() == Qt::Vertical)
559 {
560 if(m_context.m_keyboardModifiers & Qt::ShiftModifier)
561 {
562
563 // In this case, we want to make a rescale of the Y axis such
564 // that it displays full scale the data in the current X axis
565 // range only.
566
567 bool ok = false;
568
569 QCPRange value_range = getValueRangeOnKeyRange(nullptr, ok);
570
571 yAxis->setRange(value_range);
572 }
573 else
574 axis->rescale();
575 }
576 else
577 axis->rescale();
578
580
581 event->accept();
582 }
583
584 // The double-click event does not cancel the mouse press event. That is, if
585 // left-double-clicking, at the end of the operation the button still
586 // "pressed". We need to remove manually the button from the pressed buttons
587 // context member.
588
589 m_context.m_pressedMouseButtons ^= event->button();
590
592
594
595 replot();
596}
virtual void updateAxesRangeHistory()
Create new axis range history items and append them to the history.
virtual void updateContextXandYAxisRanges()
void plotRangesChangedSignal(const BasePlotContext &context)
BasePlotContext m_context
QCPRange getValueRangeOnKeyRange(QCPAbstractPlottable *plottable_p, bool &ok)

References getValueRangeOnKeyRange(), pappso::BasePlotWidget::m_context, pappso::BasePlotWidget::plotRangesChangedSignal(), pappso::BasePlotWidget::resetAxesRangeHistory(), pappso::BasePlotWidget::updateAxesRangeHistory(), and pappso::BasePlotWidget::updateContextXandYAxisRanges().

◆ axisPan()

void pappso::BaseTracePlotWidget::axisPan ( )
overridevirtual

Reimplemented from pappso::BasePlotWidget.

Definition at line 803 of file basetraceplotwidget.cpp.

804{
805 // qDebug();
806
807 // Sanity check
808 if(!m_context.m_wasClickOnXAxis && !m_context.m_wasClickOnYAxis)
809 qFatal(
810 "This function can only be called if the mouse click was on one of the "
811 "axes");
812
813 if(m_context.m_wasClickOnXAxis)
814 {
815 xAxis->setRange(m_context.m_xRange.lower - m_context.m_xDelta,
816 m_context.m_xRange.upper - m_context.m_xDelta);
817
818 // If the shift modifier key is pressed, then the user want the y axis
819 // to be full scale.
820 if(m_context.m_keyboardModifiers & Qt::ShiftModifier)
821 {
822
823 bool ok = false;
824
825 QCPRange value_range = getValueRangeOnKeyRange(nullptr, ok);
826
827 yAxis->setRange(value_range);
828 }
829 // else nothing to do we do not change the y axis scale.
830 }
831
832 if(m_context.m_wasClickOnYAxis)
833 {
834 yAxis->setRange(m_context.m_yRange.lower - m_context.m_yDelta,
835 m_context.m_yRange.upper - m_context.m_yDelta);
836 }
837
839
840 // qDebug() << "The updated context:" << m_context.toString();
841
842 // We cannot store the new ranges in the history, because the pan operation
843 // involved a huge quantity of micro-movements elicited upon each mouse move
844 // cursor event so we would have a huge history.
845 // updateAxesRangeHistory();
846
847 // Now that the contex has the right range values, we can emit the
848 // signal that will be used by this plot widget users, typically to
849 // abide by the x/y range lock required by the user.
850
852
853 replot();
854}

References getValueRangeOnKeyRange(), pappso::BasePlotWidget::m_context, pappso::BasePlotWidget::plotRangesChangedSignal(), and pappso::BasePlotWidget::updateContextXandYAxisRanges().

◆ axisReframe()

void pappso::BaseTracePlotWidget::axisReframe ( )
overridevirtual

Reimplemented from pappso::BasePlotWidget.

Definition at line 720 of file basetraceplotwidget.cpp.

721{
722 // qDebug();
723
724 // double sorted_start_drag_point_x =
725 // std::min(m_context.m_startDragPoint.x(), m_context.m_currentDragPoint.x());
726
727 // xAxis->setRange(sorted_start_drag_point_x,
728 // sorted_start_drag_point_x + fabs(m_context.m_xDelta));
729
730 xAxis->setRange(
731 QCPRange(m_context.m_xRegionRangeStart, m_context.m_xRegionRangeEnd));
732
733 // Note that the y axis should be rescaled from current lower value to new
734 // upper value matching the y-axis position of the cursor when the mouse
735 // button was released.
736
737 yAxis->setRange(xAxis->range().lower,
738 std::max<double>(m_context.m_yRegionRangeStart,
739 m_context.m_yRegionRangeEnd));
740
741 // qDebug() << "xaxis:" << xAxis->range().lower << "-" <<
742 // xAxis->range().upper
743 //<< "yaxis:" << yAxis->range().lower << "-" << yAxis->range().upper;
744
745 // If the shift modifier key is pressed, then the user want the y axis
746 // to be full scale.
747 if(m_context.m_keyboardModifiers & Qt::ShiftModifier)
748 {
749
750 bool ok = false;
751
752 QCPRange value_range = getValueRangeOnKeyRange(nullptr, ok);
753
754 yAxis->setRange(value_range);
755 }
756 // else do nothing, let the y axis range as is.
757
759
762
763 replot();
764}

References getValueRangeOnKeyRange(), pappso::BasePlotWidget::m_context, pappso::BasePlotWidget::plotRangesChangedSignal(), pappso::BasePlotWidget::updateAxesRangeHistory(), and pappso::BasePlotWidget::updateContextXandYAxisRanges().

◆ axisRescale()

void pappso::BaseTracePlotWidget::axisRescale ( )
overridevirtual

RANGE-related functions.

PLOTTING / REPLOTTING functions

Reimplemented from pappso::BasePlotWidget.

Definition at line 600 of file basetraceplotwidget.cpp.

601{
602 double xLower = xAxis->range().lower;
603 double xUpper = xAxis->range().upper;
604
605 // Get the current y lower/upper range.
606 double yLower = yAxis->range().lower;
607 double yUpper = yAxis->range().upper;
608
609 // This function is called only when the user has clicked on the x/y axis or
610 // when the user has dragged the left mouse button with the Ctrl key
611 // modifier. The m_context.m_wasClickOnXAxis is then simulated in the mouse
612 // move handler. So we need to test which axis was clicked-on.
613
614 if(m_context.m_wasClickOnXAxis)
615 {
616
617 // We are changing the range of the X axis.
618
619 // What is the x delta ?
620 double xDelta =
621 m_context.m_currentDragPoint.x() - m_context.m_startDragPoint.x();
622
623 // If xDelta is < 0, the we were dragging from right to left, we are
624 // compressing the view on the x axis, by adding new data to the right
625 // hand size of the graph. So we add xDelta to the upper bound of the
626 // range. Otherwise we are uncompressing the view on the x axis and
627 // remove the xDelta from the upper bound of the range. This is why we
628 // have the
629 // '-'
630 // and not '+' below;
631
632 // qDebug() << "Setting xaxis:" << xLower << "--" << xUpper - xDelta;
633
634 xAxis->setRange(xLower, xUpper - xDelta);
635
636
637 // Old version
638 // if(xDelta < 0)
639 //{
640 //// The dragging operation was from right to left, we are enlarging
641 //// the range (thus, we are unzooming the view, since the widget
642 //// always has the same size).
643
644 // xAxis->setRange(xLower, xUpper + fabs(xDelta));
645 //}
646 // else
647 //{
648 //// The dragging operation was from left to right, we are reducing
649 //// the range (thus, we are zooming the view, since the widget
650 //// always has the same size).
651
652 // xAxis->setRange(xLower, xUpper - fabs(xDelta));
653 //}
654
655 // We may either leave the scale of the Y axis as is (default) or
656 // the user may want an automatic scale of the Y axis such that the
657 // data displayed in the new X axis range are full scale on the Y
658 // axis. For this, the Shift modifier key should be pressed.
659
660 if(m_context.m_keyboardModifiers & Qt::ShiftModifier)
661 {
662
663 // In this case, we want to make a rescale of the Y axis such that
664 // it displays full scale the data in the current X axis range only.
665
666 bool ok = false;
667
668 QCPRange value_range = getValueRangeOnKeyRange(nullptr, ok);
669
670 yAxis->setRange(value_range);
671 }
672 // else, do leave the Y axis range unchanged.
673 }
674 // End of
675 // if(m_context.m_wasClickOnXAxis)
676 else // that is, if(m_context.m_wasClickOnYAxis)
677 {
678 // We are changing the range of the Y axis.
679
680 // What is the y delta ?
681 double yDelta =
682 m_context.m_currentDragPoint.y() - m_context.m_startDragPoint.y();
683
684 // See above for an explanation of the computation.
685
686 yAxis->setRange(yLower, yUpper - yDelta);
687
688 // Old version
689 // if(yDelta < 0)
690 //{
691 //// The dragging operation was from top to bottom, we are enlarging
692 //// the range (thus, we are unzooming the view, since the widget
693 //// always has the same size).
694
695 // yAxis->setRange(yLower, yUpper + fabs(yDelta));
696 //}
697 // else
698 //{
699 //// The dragging operation was from bottom to top, we are reducing
700 //// the range (thus, we are zooming the view, since the widget
701 //// always has the same size).
702
703 // yAxis->setRange(yLower, yUpper - fabs(yDelta));
704 //}
705 }
706 // End of
707 // else // that is, if(m_context.m_wasClickOnYAxis)
708
709 // Update the context with the current axes ranges
710
712
714
715 replot();
716}

References getValueRangeOnKeyRange(), pappso::BasePlotWidget::m_context, pappso::BasePlotWidget::plotRangesChangedSignal(), and pappso::BasePlotWidget::updateContextXandYAxisRanges().

◆ axisZoom()

void pappso::BaseTracePlotWidget::axisZoom ( )
overridevirtual

Reimplemented from pappso::BasePlotWidget.

Definition at line 768 of file basetraceplotwidget.cpp.

769{
770
771 // Use the m_context.m_xRegionRangeStart/End values, but we need to sort the
772 // values before using them, because now we want to really have the lower x
773 // value. Simply craft a QCPRange that will swap the values if lower is not
774 // < than upper QCustomPlot calls this normalization).
775
776 xAxis->setRange(
777 QCPRange(m_context.m_xRegionRangeStart, m_context.m_xRegionRangeEnd));
778
779 // If the shift modifier key is pressed, then the user want the y axis
780 // to be full scale.
781 if(m_context.m_keyboardModifiers & Qt::ShiftModifier)
782 {
783
784 bool ok = false;
785
786 QCPRange value_range = getValueRangeOnKeyRange(nullptr, ok);
787
788 yAxis->setRange(value_range);
789 }
790 else
791 yAxis->setRange(
792 QCPRange(m_context.m_yRegionRangeStart, m_context.m_yRegionRangeEnd));
793
795
798
799 replot();
800}

References getValueRangeOnKeyRange(), pappso::BasePlotWidget::m_context, pappso::BasePlotWidget::plotRangesChangedSignal(), pappso::BasePlotWidget::updateAxesRangeHistory(), and pappso::BasePlotWidget::updateContextXandYAxisRanges().

◆ clearGraphData()

void pappso::BaseTracePlotWidget::clearGraphData ( int graph_index)
virtual

Definition at line 168 of file basetraceplotwidget.cpp.

169{
170 QCPGraph *graph_p = graph(graph_index);
171
172 if(graph_p == nullptr)
173 qFatal("Programming error.");
174
175 graph_p->data().clear();
176
177 rescaleAxes();
179 replot();
180}

References pappso::BasePlotWidget::resetAxesRangeHistory().

◆ findIntegrationLowerRangeForKey()

bool pappso::BaseTracePlotWidget::findIntegrationLowerRangeForKey ( int index,
double key,
QCPRange & range )
virtual

Find a minimal integration range starting at an existing data point.

If the user clicks onto a plot at a location that is not a true data point, get a data range that begins at the preceding data point and that ends at the clicked location point.

Definition at line 289 of file basetraceplotwidget.cpp.

292{
293
294 // Given a key double value, we want to know what is the range that will
295 // frame correctly the key double value if that key value is not exactly
296 // the one of a point of the trace.
297
298 // First of all get the keys of the graph.
299
300 QCPGraph *theGraph = graph(index);
301
302 if(theGraph == nullptr)
303 throw ExceptionNotPossible(
304 "basetraceplotwidget.cpp @ indIntegrationLowerRangeForKey() -- ERROR "
305 "theGraph cannot be nullptr.");
306
307 // QCPGraphDataContainer is a typedef QCPDataContainer<QCPGraphData> and
308 // QCPDataContainer< DataType > is a Class Template. So in this context,
309 // DataType is QCPGraphData.
310 // QCPGraphData is the data point, that is the (key,value) pair.
311 QSharedPointer<QCPGraphDataContainer> graph_data_container_p =
312 theGraph->data();
313
314 QCPDataRange dataRange = graph_data_container_p->dataRange();
315
316 if(!dataRange.isValid())
317 return false;
318
319 if(!dataRange.size())
320 return false;
321
322 if(dataRange.size() > 1)
323 {
324 double firstKey = graph_data_container_p->at(dataRange.begin())->key;
325 double lastKey = graph_data_container_p->at(dataRange.end())->key;
326
327 // There is one check to be done: the user might erroneously set the mouse
328 // cursor beyond the last point of the graph. If that is the case, then
329 // upper key needs to be that very point. All we need to do is return the
330 // lower key, that is the pre-last key of the keys list. No need to
331 // iterate in the keys list.
332
333 if(key > lastKey)
334 {
335 // No need to search for the key in the keys, just get the lower key
336 // immediately, that is, the key that is one slot left the last key.
337 range.lower = graph_data_container_p->at(dataRange.end() - 2)->key;
338 range.upper = graph_data_container_p->at(dataRange.end() - 1)->key;
339
340 return true;
341 }
342
343 // Likewise, if the cursor is set left of the first plot point, then that
344 // will be the lower range point. All we need is to provide the upper
345 // range point as the second point of the plot.
346
347 if(key < firstKey)
348 {
349 range.lower = firstKey;
350 range.upper = graph_data_container_p->at(dataRange.begin() + 1)->key;
351
352 return true;
353 }
354
355 // Finally the generic case where the user point to any point *in* the
356 // graph.
357
358 range.lower =
359 graph_data_container_p->findBegin(key, /*expandedRange*/ true)->key;
360 range.upper =
361 std::prev(graph_data_container_p->findEnd(key, /*expandedRange*/ true))
362 ->key;
363
364 return true;
365 }
366
367 return false;
368}

◆ getValueRangeOnKeyRange() [1/2]

QCPRange pappso::BaseTracePlotWidget::getValueRangeOnKeyRange ( int index,
bool & ok )

Definition at line 477 of file basetraceplotwidget.cpp.

478{
479
480 // The X axis range is set. But we want to find for that X axis range the
481 // min and max Y values. This function is useful when the user asks that
482 // while changing the X axis range, the trace be always in full scale on the
483 // Y axis.
484
485 QCPAbstractPlottable *plottable_p = plottable(index);
486
487 if(plottable_p == nullptr)
488 qFatal("Programming error.");
489
490 return getValueRangeOnKeyRange(plottable_p, ok);
491}

References getValueRangeOnKeyRange().

◆ getValueRangeOnKeyRange() [2/2]

QCPRange pappso::BaseTracePlotWidget::getValueRangeOnKeyRange ( QCPAbstractPlottable * plottable_p,
bool & ok )

Definition at line 420 of file basetraceplotwidget.cpp.

422{
423
424 // The X axis range is set. But we want to find for that X axis range the
425 // min and max Y values. This function is useful when the user asks that
426 // while changing the X axis range, the trace be always in full scale on the
427 // Y axis.
428
429 QCPRange key_range(xAxis->range().lower, xAxis->range().upper);
430
431 if(plottable_p != nullptr)
432 {
433
434 return plottable_p->getValueRange(ok, QCP::SignDomain::sdBoth, key_range);
435 }
436 else
437 {
438
439 // How many graphs are currently plotted in this plot widget ?
440 int graph_count = graphCount();
441
442 // Iterate in each graph and get the y max value. Then compare with the
443 // largest one and update if necessary. Store the pointer to the graph
444 // that has a larger y value. At the end of the iteration, it will be
445 // the winner.
446
447 double temp_min_value = std::numeric_limits<double>::max();
448 double temp_max_value = std::numeric_limits<double>::min();
449
450 bool found_range = false;
451
452 for(int iter = 0; iter < graph_count; ++iter)
453 {
454 QCPGraph *plottable_p = graph(iter);
455
456 QCPRange value_range =
457 plottable_p->getValueRange(ok, QCP::SignDomain::sdBoth, key_range);
458
459 if(ok)
460 found_range = true;
461
462 if(value_range.lower < temp_min_value)
463 temp_min_value = value_range.lower;
464 if(value_range.upper > temp_max_value)
465 temp_max_value = value_range.upper;
466 }
467
468 // At this point return the range.
469
470 ok = found_range;
471 return QCPRange(temp_min_value, temp_max_value);
472 }
473}

Referenced by axisDoubleClickHandler(), axisPan(), axisReframe(), axisRescale(), axisZoom(), and getValueRangeOnKeyRange().

◆ getValuesX()

std::vector< double > pappso::BaseTracePlotWidget::getValuesX ( int index) const

Definition at line 372 of file basetraceplotwidget.cpp.

373{
374 std::vector<double> keys;
375
376 QCPGraph *graph_p = graph(graph_index);
377
378 if(graph_p == nullptr)
379 qFatal("Programming error.");
380
381 QSharedPointer<QCPGraphDataContainer> graph_data_container_p =
382 graph_p->data();
383
384 // Iterate in the keys
385 auto beginIt = graph_data_container_p->begin();
386 auto endIt = graph_data_container_p->end();
387
388 for(auto iter = beginIt; iter != endIt; ++iter)
389 keys.push_back(iter->key);
390
391 return keys;
392}

◆ getValuesY()

std::vector< double > pappso::BaseTracePlotWidget::getValuesY ( int index) const

Definition at line 396 of file basetraceplotwidget.cpp.

397{
398 std::vector<double> values;
399
400 QCPGraph *graph_p = graph(graph_index);
401
402 if(graph_p == nullptr)
403 qFatal("Programming error.");
404
405 QSharedPointer<QCPGraphDataContainer> graph_data_container_p =
406 graph_p->data();
407
408 // Iterate in the values
409 auto beginIt = graph_data_container_p->begin();
410 auto endIt = graph_data_container_p->end();
411
412 for(auto iter = beginIt; iter != endIt; ++iter)
413 values.push_back(iter->key);
414
415 return values;
416}

◆ getYatX() [1/2]

double pappso::BaseTracePlotWidget::getYatX ( double x,
int index = 0 )

Definition at line 518 of file basetraceplotwidget.cpp.

519{
520 QCPGraph *graph_p = graph(index);
521
522 if(graph_p == nullptr)
523 qFatal("Programming error.");
524
525 return getYatX(x, graph_p);
526}
double getYatX(double x, QCPGraph *graph_p)

References getYatX(), and pappso::x.

◆ getYatX() [2/2]

double pappso::BaseTracePlotWidget::getYatX ( double x,
QCPGraph * graph_p )

Definition at line 495 of file basetraceplotwidget.cpp.

496{
497 if(graph_p == nullptr)
498 qFatal("Programming error.");
499
500 QCPItemTracer *tracer_p = new QCPItemTracer(this);
501 tracer_p->setGraph(graph_p);
502 tracer_p->setInterpolating(true);
503 tracer_p->setGraphKey(x);
504 tracer_p->updatePosition();
505
506 double value = tracer_p->position->value();
507
508 tracer_p->setGraph(nullptr);
509
510 // Essential to do this because otherwise crash when closing the app.
511 removeItem(tracer_p);
512
513 return value;
514}

References pappso::x.

Referenced by getYatX().

◆ setGraphData() [1/2]

void pappso::BaseTracePlotWidget::setGraphData ( int graph_index,
const std::vector< double > & keys,
const std::vector< double > & values )
virtual

Definition at line 107 of file basetraceplotwidget.cpp.

110{
111 QCPGraph *graph_p = graph(graph_index);
112
113 if(graph_p == nullptr)
114 qFatal("Programming error.");
115
116 return setGraphData(graph_p, keys, values);
117}
virtual void setGraphData(int graph_index, const std::vector< double > &keys, const std::vector< double > &values)

References setGraphData().

Referenced by setGraphData().

◆ setGraphData() [2/2]

void pappso::BaseTracePlotWidget::setGraphData ( QCPGraph * graph_p,
const std::vector< double > & keys,
const std::vector< double > & values )
virtual

Definition at line 121 of file basetraceplotwidget.cpp.

124{
125 if(graph_p == nullptr)
126 qFatal("Pointer cannot be nullptr.");
127
128 // Version that is now deprecated (20200924)
129 // graph_p->setData(QVector<double>::fromStdVector(keys),
130 // QVector<double>::fromStdVector(values));
131
132 QVector<double> key_qvector;
133 QVector<double> value_qvector;
134
135
136#if 0
137 // Now replace the graph's data. Note that the data are
138 // inherently sorted (true below).
139
140 // The begin() -- end() ranges constructor did not work as of
141 // Qt 5.14.2 this day: 20200721
142
143 key_qvector =
144 QVector(keys.begin(),
145 keys.end());
146 value_qvector =
147 QVector(values.begin(),
148 values.end());
149#endif
150
151 for(auto &value : keys)
152 key_qvector.push_back(value);
153
154 for(auto &value : values)
155 value_qvector.push_back(value);
156
157 graph_p->setData(key_qvector, value_qvector, true);
158
159 graph_p->setPen(m_pen);
160
161 rescaleAxes();
163 replot();
164}
QPen m_pen
Pen used to draw the graph and textual elements in the plot widget.

References pappso::BasePlotWidget::m_pen, and pappso::BasePlotWidget::resetAxesRangeHistory().

◆ toTrace() [1/4]

pappso::Trace pappso::BaseTracePlotWidget::toTrace ( const QCPGraph * graph_p) const

Definition at line 867 of file basetraceplotwidget.cpp.

868{
869 if(graph_p == nullptr)
870 qFatal("Programming error. Pointer cannot be nullptr.");
871
872 pappso::Trace trace;
873
874 QSharedPointer<QCPGraphDataContainer> graph_data_container_p =
875 graph_p->data();
876
877 // Iterate in the keys
878 auto beginIt = graph_data_container_p->begin();
879 auto endIt = graph_data_container_p->end();
880
881 for(auto iter = beginIt; iter != endIt; ++iter)
882 trace.push_back(pappso::DataPoint(iter->key, iter->value));
883
884 return trace;
885}

◆ toTrace() [2/4]

pappso::Trace pappso::BaseTracePlotWidget::toTrace ( const QCPRange & x_axis_range,
const QCPGraph * graph_p ) const

Definition at line 901 of file basetraceplotwidget.cpp.

903{
904
905 // Make a Trace with the data in the range.
906 Trace data_trace;
907
908 QSharedPointer<QCPGraphDataContainer> graph_data_container_sp;
909
910 graph_data_container_sp = graph_p->data();
911
912 // Grab the iterator to the start to the x axis range
913 auto beginIt = graph_data_container_sp->findBegin(x_axis_range.lower,
914 /*expandedRange*/ true);
915 // Grab the iterator to the end of the axis range
916 auto endIt = graph_data_container_sp->findEnd(x_axis_range.upper,
917 /*expandedRange*/ true);
918
919 for(auto iter = beginIt; iter != endIt; ++iter)
920 data_trace.push_back(DataPoint(iter->key, iter->value));
921
922 return data_trace;
923}

◆ toTrace() [3/4]

pappso::Trace pappso::BaseTracePlotWidget::toTrace ( const QCPRange & x_axis_range,
int index ) const

Definition at line 889 of file basetraceplotwidget.cpp.

890{
891 QCPGraph *graph_p = graph(index);
892
893 if(graph_p == nullptr)
894 qFatal("Programming error.");
895
896 return toTrace(x_axis_range, graph_p);
897}
pappso::Trace toTrace(int index) const

References toTrace().

◆ toTrace() [4/4]

pappso::Trace pappso::BaseTracePlotWidget::toTrace ( int index) const

Definition at line 858 of file basetraceplotwidget.cpp.

859{
860 QCPGraph *graph_p = graph(index);
861
862 return toTrace(graph_p);
863}

References toTrace().

Referenced by toTrace(), and toTrace().


The documentation for this class was generated from the following files: